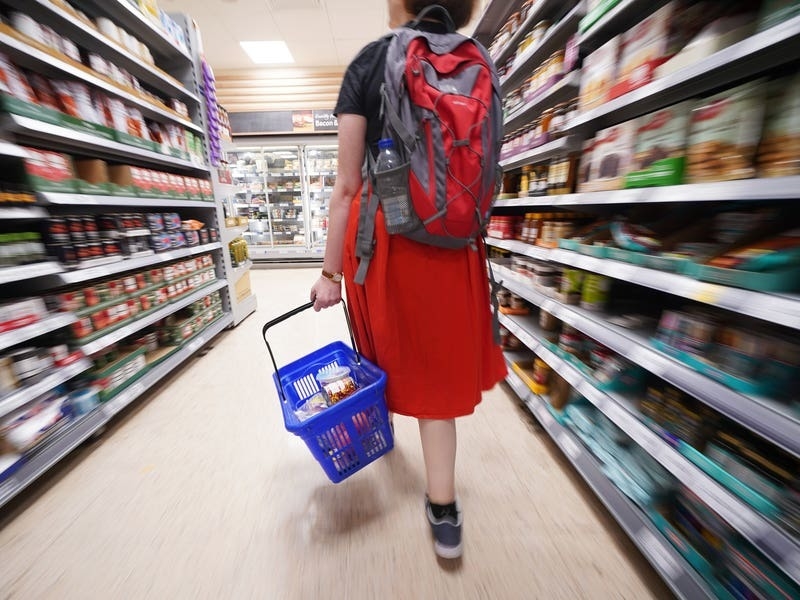
Soaring food and non-alcoholic drink prices kept UK inflation in double-figures last month and continued to weigh hard on household budgets.
More expensive bread, cereals and chocolate all caused the overall average price of food and non-alcoholic drinks to increase 19.1% in the year to March.
Price rises have partly been linked to the Russian invasion of Ukraine, which forced the cost of export products including vegetable oils and grains higher.
Recent fruit and vegetable shortages, due to poor weather conditions in north Africa and Spain, also contributed to inflation, according to the Office for National Statistics (ONS).

Here are some examples of how the cost of food and non-alcoholic drinks have increased in the past year.
The figures are based on the CPI (Consumer Prices Index) measure of inflation and have been published by the ONS.

– Olive oil 49.2%
– Sugar 42.1%
– Low-fat milk 38.8%
– Whole milk 37.9%
– Sauces, condiments, salt, spices & culinary herbs 33.7%
– Cheese & curd 33.6%
– Eggs 32.0%
– Frozen vegetables other than potatoes 30.2%
– Pork 25.2%
– Edible ices & ice cream 24.3%
– Pasta products & couscous 24.1%
– Butter 22.7%
– Yoghurt 21.9%
– Jams, marmalades & honey 20.9%
– Ready-made meals 20.9%
– Fresh or chilled vegetables other than potatoes 20.5%
– Potatoes 20.4%
– Tea 19.0%
– Bread 18.9%
– Mineral or spring waters 18.3%
– Poultry 18.0%
– Crisps 17.9%
– Pizza & quiche 17.2%
– Fish 16.7%
– Coffee 15.6%
– Beef & veal 14.8%
– Chocolate 14.6%
– Fruit & vegetable juices 14.1%
– Rice 13.0%
– Soft drinks 12.2%
– Frozen seafood 11.2%
– Fruit 10.6%
– Breakfast cereals & other cereal products 9.0%
– Lamb & goat 6.4%
– Dried fruit & nuts 5.8%.